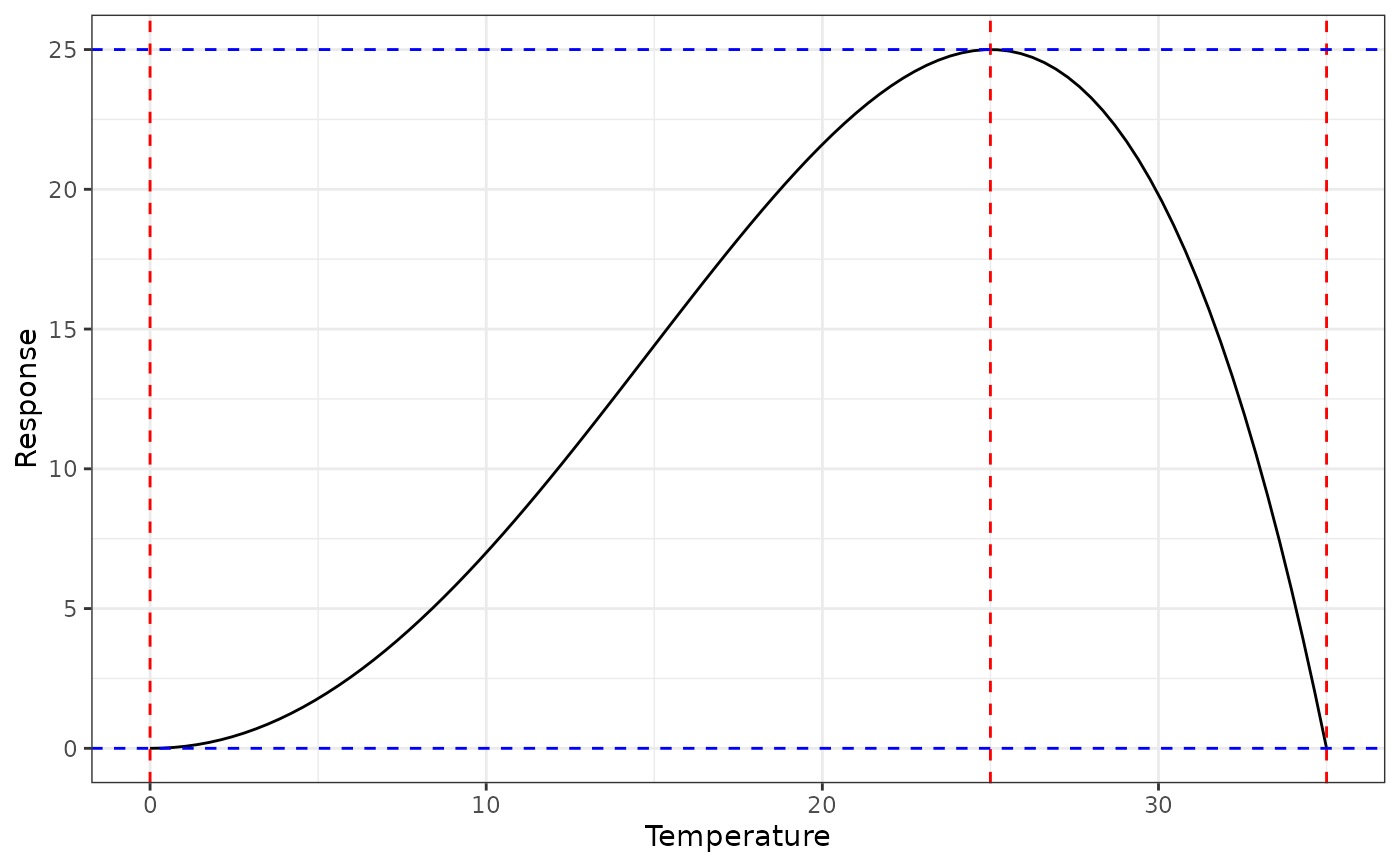
Calculate the shape of the Wang and Engel beta temperature response function defined by three cardinal temperatures.
Arguments
- min_temp
The minimum cardinal temperature.
- opt_temp
The optimum cardinal temperature.
- max_temp
The maximum cardinal temperature.
- beta
The exponent applied to the relative response (0-1). Default is 1.
- n
The number of evenly spaced temperatures between
min_tempandmax_tempat which the response is evaluated. Default is 101.
References
Wang E, Engel T (1998). Simulation of phenological development of wheat crops. Agricultural Systems 58, 1-24.
Examples
library(ggplot2)
tt <- wang_engel_tt(0, 25, 35)
tt |>
ggplot() +
geom_line(aes(x = x, y = y)) +
labs(x = "Temperature", y = "Response") +
geom_vline(xintercept = c(0, 25, 35), linetype = "dashed", color = "red") +
geom_hline(yintercept = c(0, 25), linetype = "dashed", color = "blue") +
theme_bw()
 # Change the beta and number of points
tt <- wang_engel_tt(0, 25, 35, beta = 0.5, n = 36)